Energy & grid.
Power grids as they run: clearing prices, demand, fuel mix and cross-border flows.
Reading…
Power your idea with Panbiota → · Open the instrument · Intelligence, not advice.
What it answers.
- How often did South Australia's power price fall below zero this month, and at what times of day?
- Why did Britain's imbalance price spike yesterday evening?
- How much more does power cost in New York City than upstate right now, and are the lines into the city full?
- When a large plant trips on a still evening, does Britain's imbalance price really jump within the hour?
- If next week turns cold and still with the cable to France out, how exposed is our book to imbalance?
- What had the market been told about this outage at the moment we traded?
Who uses it.
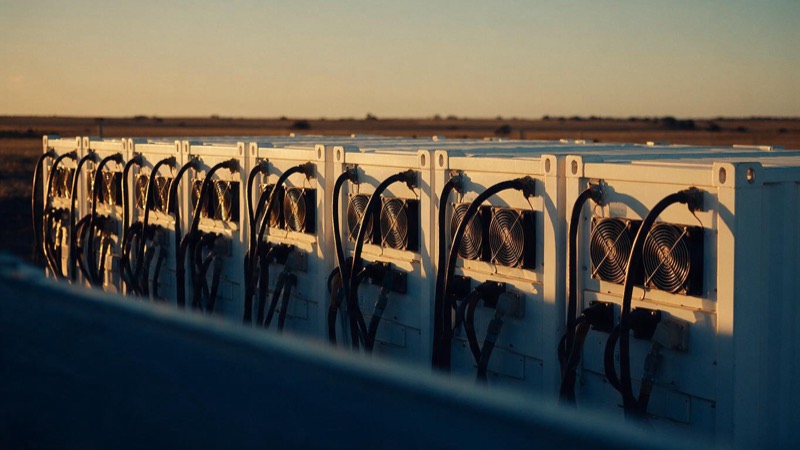
Battery and storage operators
Charge, discharge or hold, every five minutes. Negative prices and imbalance spikes, seen live, let them schedule against today's grid.
Electricity suppliers
Close a supply gap the same day, or settle it at the imbalance price? A shortage warning for the next half hour, with its cause, settles it.
Power traders and risk desks
Will a move in day-ahead or zone spreads hold? A full border or tripped plant, seen live, with what it likely means for price.

Energy managers at data centres, factories and cold stores
When to run cooling, vehicle charging and heavy computing. An alert as spare capacity thins, plus the cleanest half hours ahead.
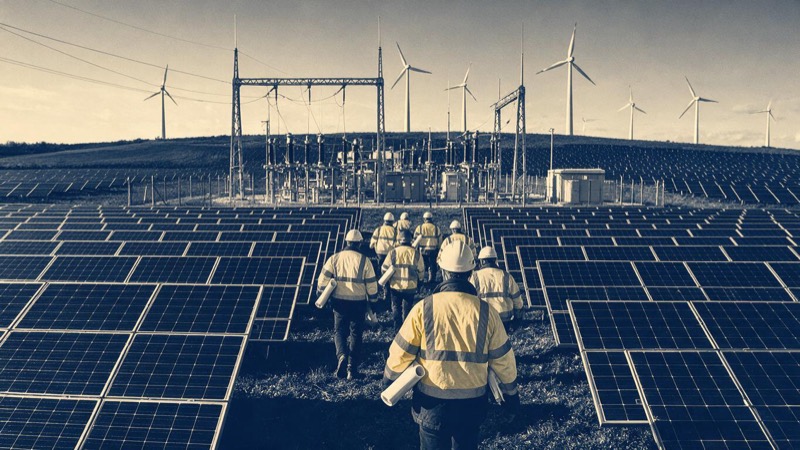
Wind and solar developers
Where to build and connect. A count of negative-price hours at each place shows where the grid has more power than it can move.
What we model, test and run.
The still, tight evening
Low wind, an outage, a full interconnector, demand climbing after sunset. Recognised the moment it forms, from Britain to South Australia, with what it likely means for prices.
Power either side of a border
The same megawatt-hour clears at different prices in Britain and France, or Tokyo and Kansai. When the gap beats cable costs, losses and fees, and how long it is likely to last.
Outage on a still evening
Does a gigawatt outage in low wind push Britain's imbalance price above day-ahead within the hour? How often, and how far.
Cold, still week stress run
A cold, still week with a nuclear unit and an interconnector out, run on your contracts, battery or positions. Your imbalance exposure, and how bad it could get.
Grid response engine
A state you chose forms; the action you set follows. A battery charge, cooling moved to cleaner half hours, an intraday bid. Runs in your systems, on your rules.
What we build for you.
Price-split map
Lights up wherever neighbouring zones pull apart: Germany from France, New York City from upstate, Tokyo from Kansai. Each split: how long it has lasted, how full the lines are.
Negative-price and spike scanner
Every interval below zero or near the price cap, from South Australia to Germany. Running counts by day and month, and the live price against day-ahead.
Outage response model
Every outage notice for plants, cables and lines. As each lands: the likely move in day-ahead and imbalance prices for that fuel and size. Estimates, not a call.
Battery and flexibility simulator
Your battery rules, put through the grid's hardest days. Outcomes in cycles, wear and worst days. Compare rule sets before changing the live schedule.
Grid record and forecast scorecard
Every demand, wind, solar and carbon forecast, scored by hour and season: where each misses most, and which fuel fills the gap.
Delivered to you.

Morning grid reading
Before tomorrow's bids close: what is unusual in price, demand, spare capacity and fuel mix. Plus live outages and yesterday's forecast misses.

Grid assistant for energy managers
In your team chat: alerts on thin capacity, system warnings and price spikes. Daily: the cleanest half hours ahead.
Imbalance exposure reports
Your imbalance exposure each half hour against what you bought or sold ahead. Settlement checked against your meters, plus a simulated range for next week.
Outage archive for compliance teams
For compliance teams: what the market had been told about any outage at the moment of any trade.
Reading…
Power your idea → · Open the instrument · Intelligence, not advice.
We build the intelligence.