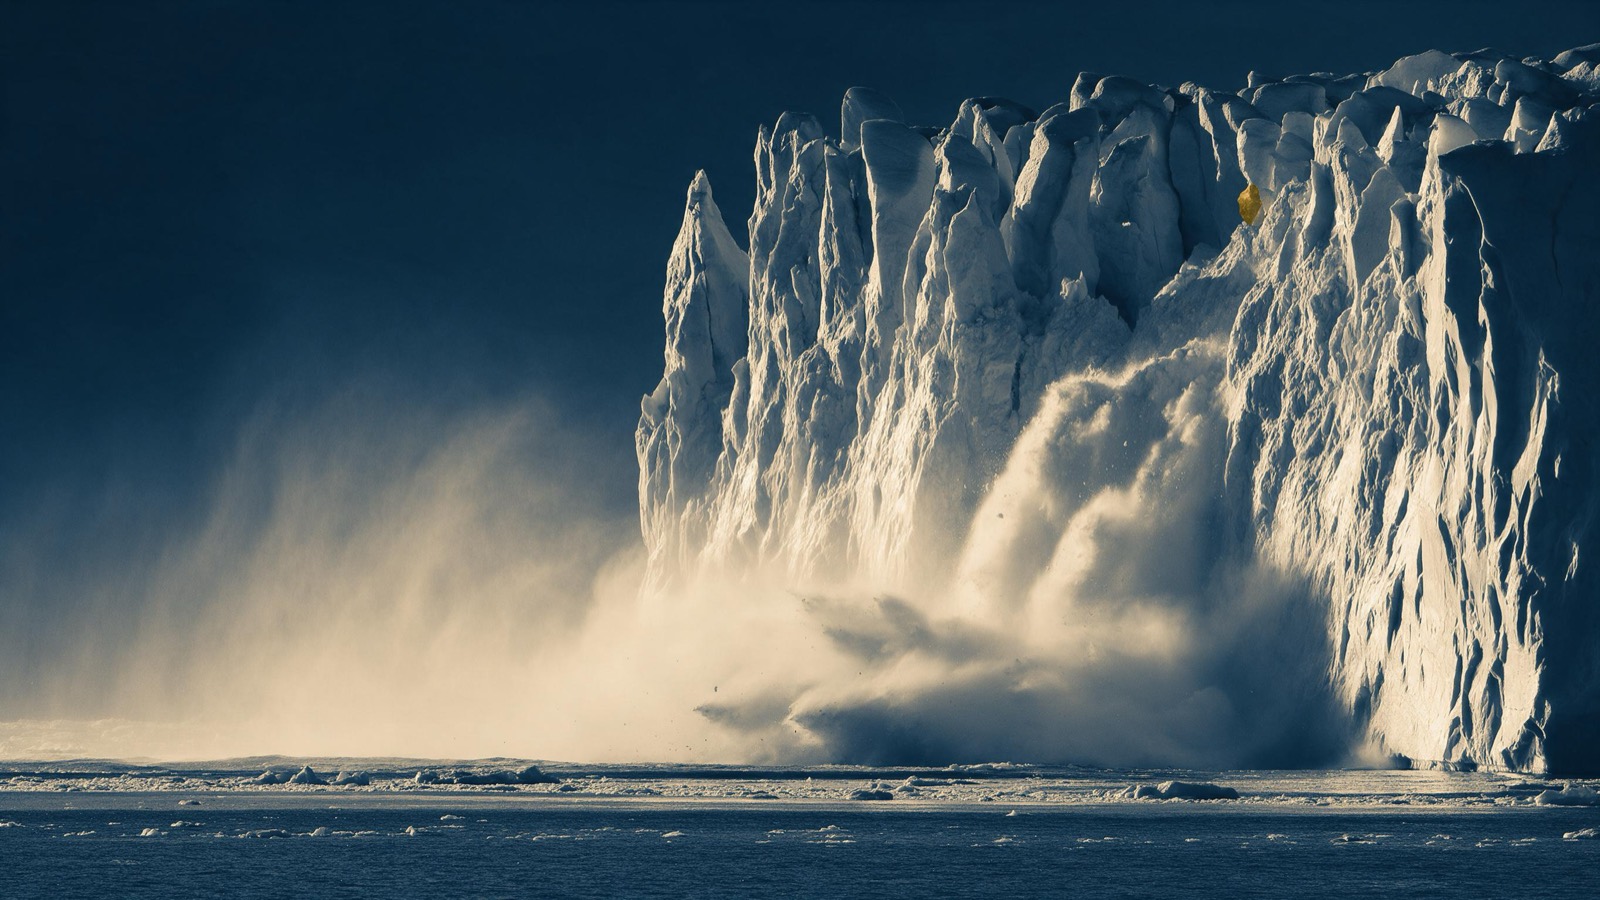
Climate & earth systems.
Every forecast, every reading, every shift: the most intelligent view of the planet.
Reading…
Power your idea with Panbiota → · Open the instrument · Intelligence, not advice.
What it answers.
- Has the latest forecast run turned colder for northern Europe next week, and by how much?
- When two forecast runs in a row turn colder, does the shift really tend to hold, or does it reverse?
- Is the river beside our depot rising faster than usual, and how high could it peak?
- If a major hurricane made landfall near our sites next week, how many of our locations could sit inside the surge?
- Was that earthquake off Japan revised up or down, and are the aftershocks easing?
- Has any forest near the farms we buy cocoa from been cleared or burned since last week?
Who uses it.
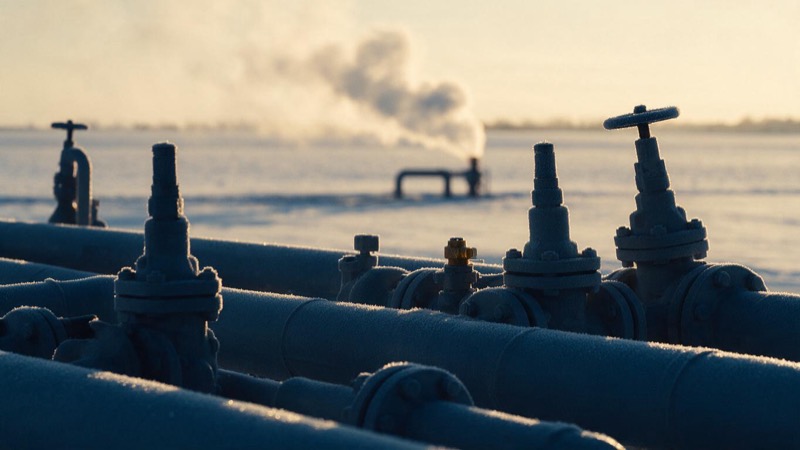
Gas and power traders
Before the trade: how far the latest run moved heating or cooling demand, and whether such a shift is likely to hold.
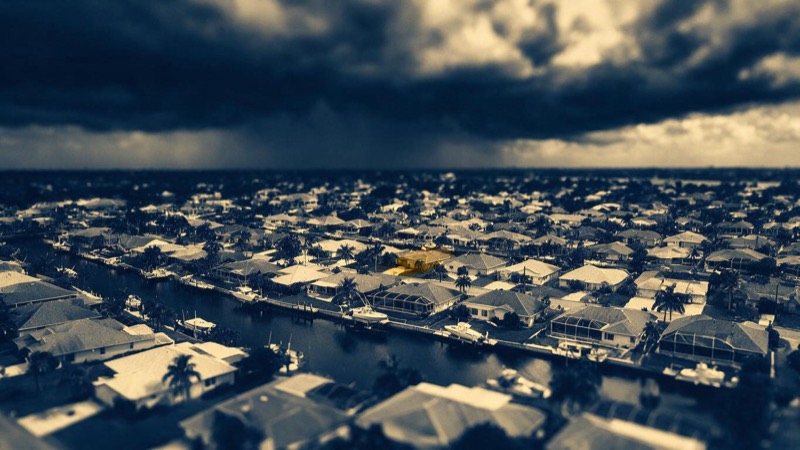
Insurers and reinsurers
How many insured locations sit in a hurricane's path? Track and surge redrawn over them at every update; pricing and claims stay with the insurer.
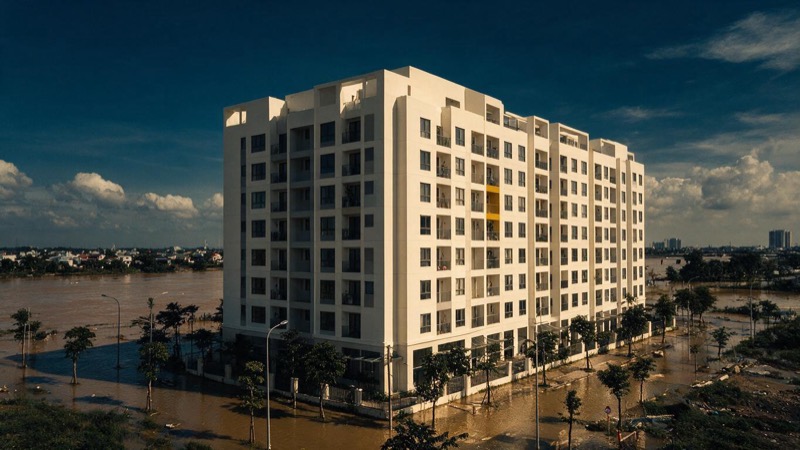
Lenders, property funds and infrastructure owners
Stating each site's flood, surge, heat and wildfire exposure. Asset by asset, uncertainty stated, traceable by an assurer.
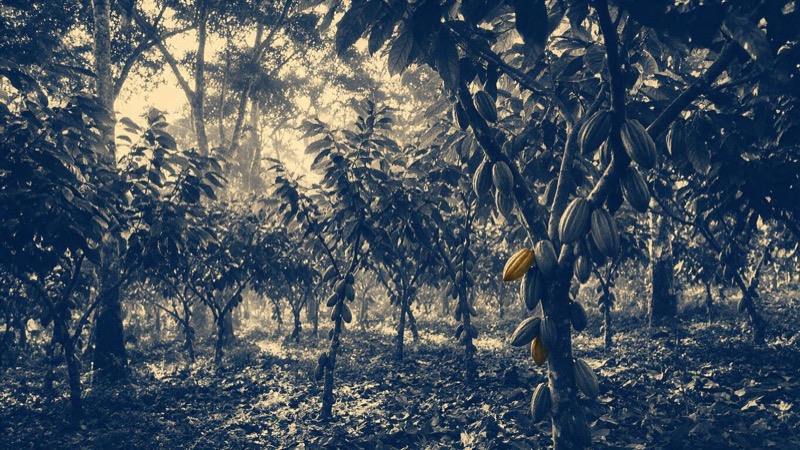
Sourcing teams at cocoa, coffee, soy and timber buyers
Proving clean supply under Europe's deforestation rules. New forest loss or fire near supplier plots, flagged that week.
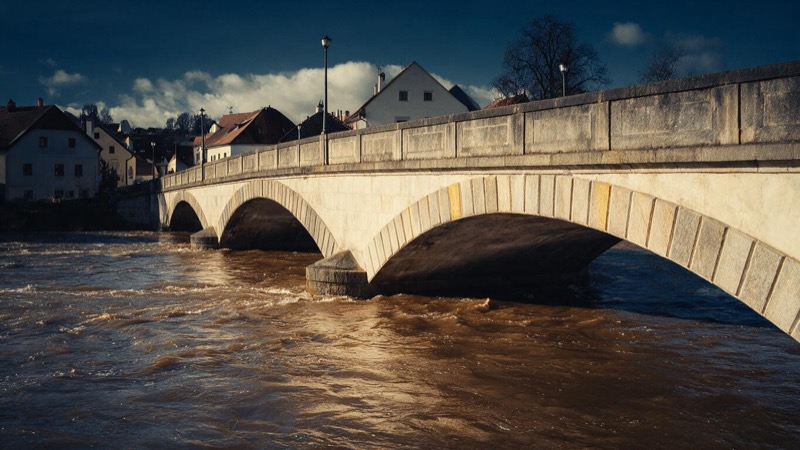
Councils and emergency planners
Barriers, road closures, rest centres? Which rivers rise fastest, with a clear account for the review.
What we model, test and run.
Heavy rain on saturated ground
Rivers already high, a heavy-rain warning in force, forecast runs agreeing, and a fast climb before any flood warning. When it forms: likely peak, hours to peak, and how much warning there will be.
One crop, two origins
Two origins of one crop, such as cocoa, when forest loss is flagged near suppliers in only one. Weighed against price, switching, tracing and freight.
Two runs in a row tend to stick
Two runs in a row shift northern Europe's heating demand one way: does it hold 48 hours? How often, and how far.
Past hurricanes on today's portfolio
Past hurricanes, and the paths a live storm could take, run over your locations with surge. Locations in the footprint, down to the worst path.
Earth-hazard tracking engine
Follows every forecast run, warning, river reading, quake, fire and forest-loss alert. Orders flood barriers up, starts shutdown checklists, holds supplier shipments. Runs in your systems, on your rules.
What we build for you.
Forecast scorecard and run alert
Weather and air-pollution forecasts, scored city by city. Alerts where heating or cooling demand moved more than usual.
River rise model
Every river station in England, against its own normal range. Fast climbs light up, warning or not, with likely peak, hours to peak and notice given.
Hazard tracker
Quakes, tropical storms, floods and wildfires from first report. Each alert step shows how likely a storm is to reach red. US gauges show surge building.
Site and supplier radar
Your warehouses, plants and supplier farm plots, lit when a warning, rising river, quake, fire or forest loss comes near. Monthly report; forest flags marked for ground checks.
Planet vital-signs board
A board of global temperature against normal, carbon dioxide against last year, polar sea ice and upper-ocean heat. Provisional figures marked, record claims checkable.
Delivered to you.
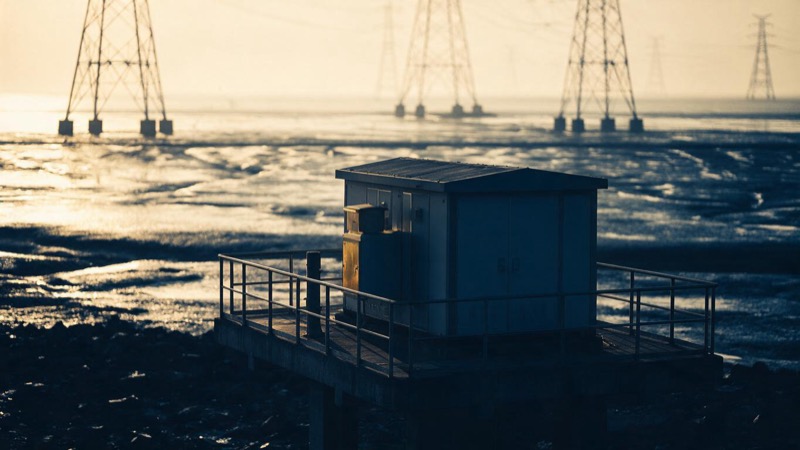
Physical-risk assessment by asset
Each site assessed for flood, surge, extreme heat, wildfire and quake, now and under future warming, with uncertainty stated.
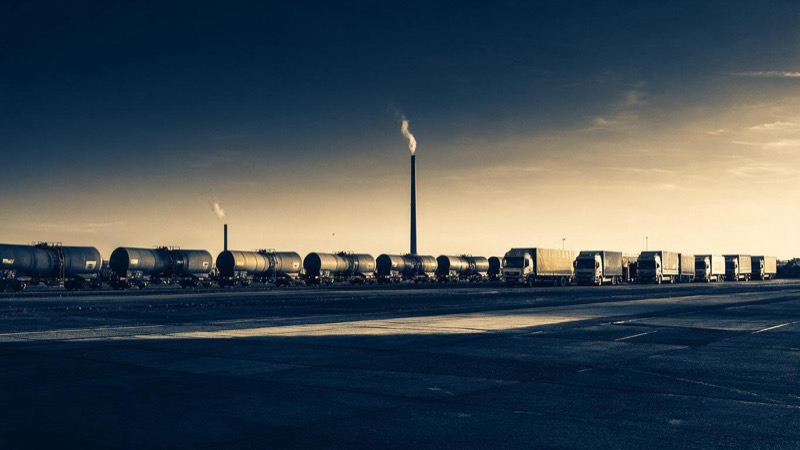
Emissions inventory
Scope 1, 2 and 3 emissions inventory: own operations, bought energy, suppliers and customers. Boundary and method documented, every line traceable.
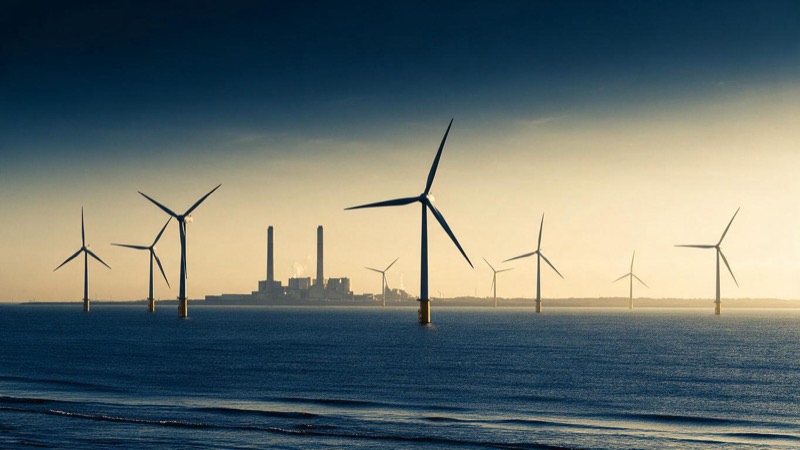
Scenario analysis and disclosure package
Warming and transition scenarios with every pathway assumption declared and sensitivities shown. Assembled into a disclosure package ready for assurance.
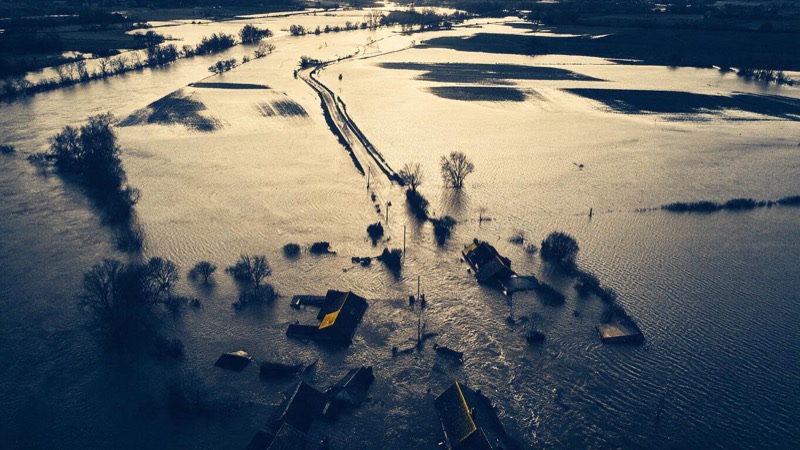
Event briefings for licensed insurers
After each major quake, hurricane or flood: where it struck, its revisions, and which insured locations sit inside. For licensed insurers, with an in-chat assistant.
Reading…
Distribution
Latest events (UTC)
Power your idea → · Intelligence, not advice.
Reading…
Distribution
Latest events (UTC)
Power your idea → · Intelligence, not advice.
We build the intelligence.