
Insurance & actuarial.
Quakes, storms, floods and fires as they unfold, then the claims that follow.
Reading…
Power your idea with Panbiota → · Open the instrument · Intelligence, not advice.
What it answers.
- Which of our insured sites are inside a live warning area right now, and what is the sum insured there?
- How far has this hurricane's forecast landfall moved since yesterday's bulletins?
- How often has an orange alert like this one become a declared disaster, and how quickly?
- If this hurricane came ashore 50 miles further along the coast, what would it do to our sums insured and reinsurance layers?
- Does rising flu test positivity really run ahead of excess deaths among the over-75s?
- Are deaths running above normal this winter, and in which age groups and regions?
Who uses it.
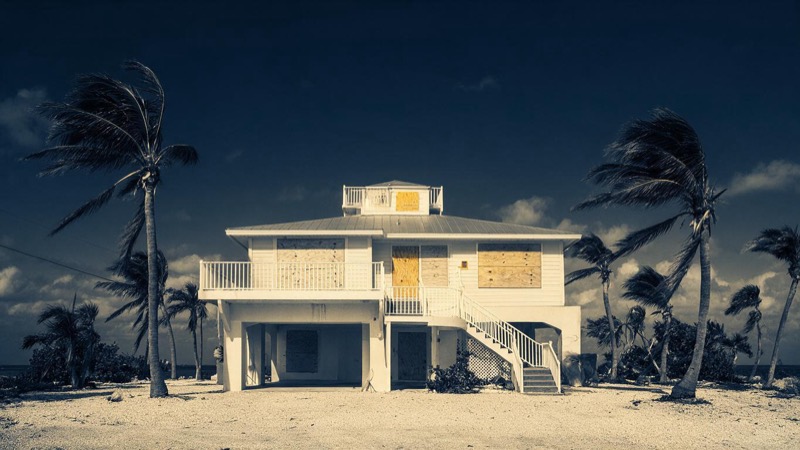
Catastrophe bond and insurance-linked securities funds
Hurricane near land, or a large quake: hold, sell or buy? Each forecast or loss-rating revision shows how the threat to every bond moves.
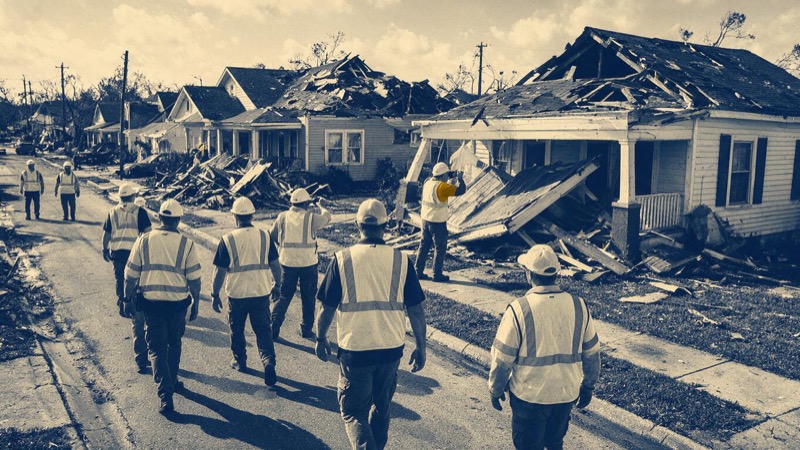
Catastrophe risk desks at insurers and reinsurers
Keep each region within limits and size your own cover. Event footprints over your policies, repeat strikes counted, show risk building before claims arrive.

Corporate treasurers and risk managers
Insure plants from Florida to Japan: buy cover or carry the loss? Each site's quakes, storms, floods and fires, flagged as they strike.

Pricing and reserving actuaries
Next year's rates, and an event's cost before claims are in. How often each peril struck each region, how hard, and what was paid.

Life, pension and annuity actuaries
Deaths running above or below normal: a passing wave, or a reason to change life-expectancy assumptions? Weekly readings by age and region, with flu and heat alongside.
What we model, test and run.
Hurricane on wet ground
Hurricane days from the coast, landfall drifting towards insured areas, flood warnings already up along its track. What it has meant before, in counties declared and flood claims paid, and what it likely means now.
One peril, two prices
A catastrophe bond and a reinsurer, pricing one peril such as Florida hurricane. From your own quotes: when the gap beats structuring, trigger and timing costs, and for how long.
Flu runs ahead of deaths
When flu positivity in England rises three weeks running: how often above-normal over-75 deaths follow within four weeks.
Past catastrophe on today's book
A hurricane, quake or flood on your sites, moved and strengthened. Out: loss range, worst sites, and how often each layer or bond trigger is hit.
Catastrophe response and trading engine
A hurricane warning or large quake: new policies halted there, adjusters alerted, catastrophe bond orders worked inside hard limits. Runs in your systems, on your rules, with an instant stop.
What we build for you.
Live peril map
Every quake, warning, hurricane track and satellite fire on a map over your insured sites. River gauges show today's return period. Alerts give sites affected and total sum insured.
Landfall drift model
Every bulletin for each Atlantic and eastern Pacific hurricane, and how far past landfall forecasts drifted. Today's forecast becomes a band, with your sums insured inside each part.
Alert-to-loss scorecard
Every disaster alert and quake loss rating followed to declaration and claims paid. Per peril and colour: how often, how fast, how far revised.
Accumulation model
Days under the most serious weather warnings, region by region across Europe and the US, with repeat strikes flagged. Each season set beside claims from similar past seasons.
Weekly excess-deaths gauge
Deaths above seasonal normal, by age and region in England and Wales, by state in the US. Flu positivity and heatwaves alongside; runs above or below normal flagged.
Delivered to you.

Morning catastrophe briefing and desk assistant
Before work in London, New York or Tokyo: overnight quakes, storms, floods and fires, graded against history. Plus an assistant in your team chat.

Portfolio screening for brokers, treasurers and lenders
Your insured sites, plants or mortgaged homes, checked against live warnings, quakes and fire detections. Which are hit, and the total value at stake.

Trigger records for licensed parametric insurers
Each quake size or gauge level behind a trigger, independently verified and dated. Any payment decision stays with you.
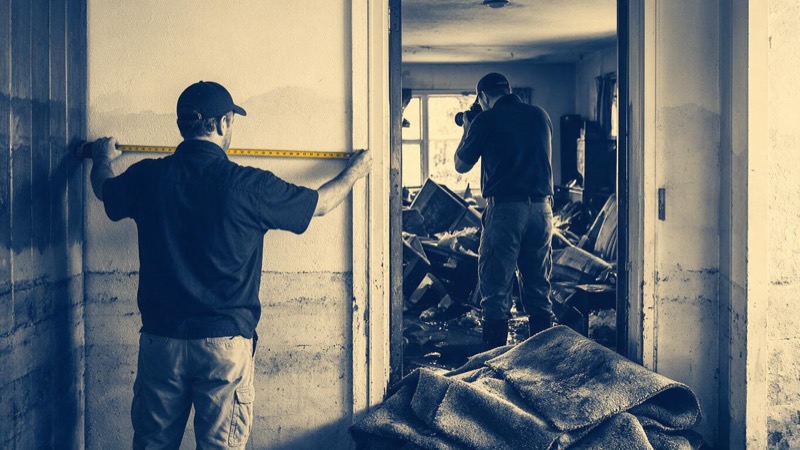
Event files for reserving and review
After a major event: the full timeline, first alert to claims paid. Built for reserving actuaries, reinsurers and auditors.
Reading…
Power your idea → · Open the instrument · Intelligence, not advice.
Reading…
Distribution
Latest events (UTC)
Power your idea → · Intelligence, not advice.
We build the intelligence.